What is jsErrLog
|
If there is a javascript error on your page then your user sees it, but you don't know that there's a problem unless they contact you (more likely they simply close the browser and never come back)
jsErrLog is a self-contained service that captures the javascript error (so it doesn't scare the user) and sends the details back to the logging server so you can review (and resolve) the problem. For Web developers you can think of it a light-weight javascript [Dr] Watson equivalent which gives you simple access to a limited set of SQM data. jsErrLog is highly performant and is designed to fail gracefully - if there's a problem with the service it won't impact your application in any way. Free, simple and fail-safe... and helps you deliver a better website. What more could you want? You can find out more about jsErrLog via my blog posts, follow jsErrLog on Twitter or reach out with questions to Offbeatmammal on Twitter. | Tweets by @jsErrLog |
| Tweet |
|
 |
Integrating jsErrLog into your site
<script type="text/javascript" src="http://jserrlog.appspot.com/jserrlog-min.js"></script>
<script type="text/javascript">
// Configure site parameters
//jsErrLog.debugMode = true;
// Optionally add additional debug information to the jsErrLog.info message field
//jsErrLog.info = "Populated the Info Message to pass to logger"
</script>
If you want the page to still throw javascript errors locally just set the debugMode to true and errors will be reported and then passed back to the browser.
At any time in your script you can update that value of the jsErrLog.info variable and that will be passed through to the report (note: it is truncated at 512 characters to protect the POST limit of 2048 characters)
If you already have your own error trapping logic that connects to the window.onerror event simply make sure it has been defined before you include the jserrlog.min.js file and after reporting the error the details will be passed to your existing handler.
If you want to see what the javascript is doing remove the -min and review jserrlog.js
If you want to check responses from the service you can either monitor the replies from logger.js in a tool such as Fiddler or use the Network resources in your browsers Developers Tools capabilities to review the message returned: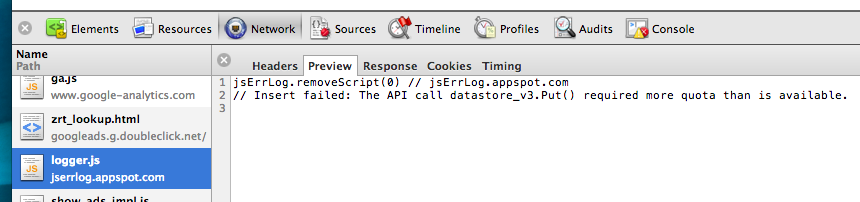
If you deploy the script anywhere I'd love to know. Please get in touch with me via this blog post and please follow jsErrLog on Twitter for updates (or offbeatmammal for more random stuff).
Sample Errors and Viewing Reports
But what if you don't want a report on-screen? Well, fear not. We expose an XML data feed for your reports. If you know the URL you can access it directly eg http://jserrlog.appspot.com/report.xml?sn=http://blog.offbeatmammal.com or simply click the "XML" link from the on-screen report. You can also request that the XML is formatted as RSS by adding the type=rss parameter eg http://jserrlog.appspot.com/report.xml?sn=http://blog.offbeatmammal.com&type=rss or clicking the "RSS" link from the on-screen report.
You can see samples of the types of errors trapped here and here.
Caveats
- To avoid overrunning field lengths in the database I do hard truncation on strings (eg the server path is capped at 500 characters). I now assume all data passed is unicode (UTF-8) as we were losing some data from various EU customers.
- I have turned on log truncation, but don't worry - the system keeps the last 365 days worth of data on file. If you need me to keep data for your domain for longer please get in touch and I can add an exemption.
- Because this is running on the free Google AppEngine service if the database is full or the CPU is exhausted it won't work. As datastore writes seem to be the thing we block on most often I have limited that on a "writes per domain per 24hour (rolling window)" basis. If I get enough folks interesting in using and supporting it I'm happy to scale accordingly but I'm not able to underwrite the service on an on-going basis. See below for details on how to donate.
- As I'm trying to keep things below the free thresholds the XML and RSS feeds have specific TTLs and use memcache to only do the "expensive" queries every hour so if you're polling them you won't see instance changes. Let me know if that's a problem. Please do not repeatedly poll the XML/RSS feeds for data if you are not reviewing it (if it becomes expensive I will have to rate-limit those as well)
- At the moment while this works as expected in IE, Firefox and Chrome (v10 and later, including ChromeOS) and Safari 5.1 and above (this bug in webkit is still causing some problems on Windows). Opera.Next (v11.60 or v12 with Presto/2.10.229 JS engine) is now working as well (hopefully GA soon). Windows Phone 7.5 (Mango) works, though Android browser does not, though Silk on the new Kindle Fire HD tablets does work. If you find a browser/OS combination that works (or doesn't work) please let me know here.
The code
If you deploy the script anywhere I'd love to know what you're using it for and how it's helped you.
| If you've found it useful would you consider supporting the service? |
Thanks
Code was edited using skEdit on OSX. The backend is Python and the front-end HTML and Javascript all running off Google App Engine. The client-side javascript library was minimized using Google's Closure Compiler
For developers who just need a simple tool for testing in Chrome, you should check out the great jsError extension.
| jsErrLog is brought to you by an Offbeatmammal. If you've found it useful would you consider supporting the service, either via my Amazon Wishlist or the link on the right? |